A Global Heat Map: Identifying hot spots for corporate abuse

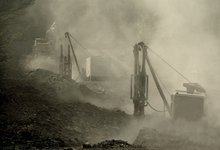
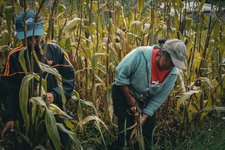
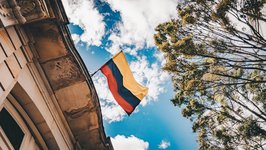
Photo: Canva
By Jennifer Teufel and Dr. Anna Würth, German Institute for Human Rights
The German Supply Chain Due Diligence Act has now been in force for almost two years. It obliges companies to take measures to prevent specific human rights and environmental harms along their global supply chains. As companies implement the law, we wanted to know whether changes in company practices will result in changes for rights holders and how these changes could be made visible.
The German Institute for Human Rights (GIHR) commissioned a data analyst to create a tool that displays the analysis of over 15,000 individual entries from the Business & Human Rights Resource Centre (the Resource Centre) database, covering the period from 1 January 2017 to 9 November 2022 as a baseline. This set was then converted into a heat map.
What’s in the Global Heat Map?
The heat map is populated by data from the Resource Centre. It encompasses news items related to business impacts on human rights reported between 2017 and 2022. These news items are enriched with metadata added by researchers according to categories used by the Resource Centre to report on human rights related issues, with tags based on the Universal Declaration of Human Rights and internationally recognised human rights treaties.
The map visualises hot spots for news items including alleged human rights and environmental abuses. Users can filter by issue, sector, type of affected persons, related countries, or year when the news was reported.
The heat map consists of two sections. The first section contains issues, while the second section focuses on types of rights and rights-holders affected by alleged abuses. All charts and tables in both sections can be used to further filter.

The Resource Centre database of news items is a mix of allegations of abuse as well other developments, both positive and negative. In developing the heat map, we wanted to gain a clear picture of abuse affecting rightsholders, and so to exclude as far as possible “positive” news stories from the Resource Centre database, such as developments in due diligence legislation, company statements and announcements. With the help of business and human rights experts, criteria were established to narrow down the data set, interpreting news items to classify them as types of alleged corporate abuses. The criteria for filtering for types of alleged corporate abuses have been designed specifically for the Heat Map. The results presented are therefore not necessarily reproducible by users on the Resource Centre website, nor will they necessarily align with Resource Centre briefings and analyses that have alternate criteria for the identification of allegations.
How to read the Global Heat Map
The heat map reflects patterns of issues, involved sectors, affected persons, countries where incidents occurred and/or companies are headquartered, and the year in which the news was reported. It is most useful when looking at longer time periods to identify trends across multiple years. For example: The heat map displays that between 2017 and 2022, the mining sector was most frequently linked to reports, followed by oil, gas and coal, and technology, telecom and electronics. Looking at companies headquartered in the EU (filter: EU27), the picture slightly changes: the sector which appeared most was oil, gas and coal, followed by clothing and textile, then mining.
While factors such as Resource Centre staff size and capacity, or better complaints channels and media sensitivity may play a role here, the number of alleged abuses against companies worldwide has increased steadily since 2017, except for 2018, with a steep rise from 2020 to 2021. The share of companies based in the EU (EU27) was 27% in 2017. In the years between 2018 and 2022, the numbers fluctuated between 21% and 24% of the total.
The tags used most frequently by BHRRC to categorise alleged abuses globally between 2017 and 2022 (discounting the tag ‘lawsuits and regulatory action’, which may refer to the context in which abuse was raised rather than itself constituting an abuse) are ‘clean, healthy and sustainable environment’, followed by ‘labour rights’. When looking at the most frequently used BHRRC tags in relation to companies headquartered in the EU, alleged labour rights abuses occur more frequently than abuses related to a clean, healthy and sustainable environment in relation to EU companies.
What are its limitations?
The heat map has technical limitations. An entry may be listed multiple times due to different dimensions of the alleged abuse: An alleged abuse may, for example, relate to land rights and Indigenous Peoples' rights and to several actors (company 1, company 2).
Except for a specific filter (EU27), the heat map strives to filter by countries where the alleged abuse has occurred, but not by a company's headquarter. In addition, the heat map does not (yet) automatically download all new relevant entries from the BHRRC website – this process is currently done manually but we hope to automate it in 2025. The heat map does not provide absolute numbers of alleged human rights and environmental abuses, as the Resource Centre collects publicly reported information and is led by a particular focus on sectors and issues of strategic priority: labour rights in global supply chains, tech and rights, and a responsible natural resource use and the just energy transition. Also, public information the Resource Centre has to rely on, whilst from numerous sources, only represents the tip of an iceberg and much abuse goes un(der)reported. For this reason, the heat map is currently aimed at researchers and experts in the field of business and human rights, who can control the methodological difficulties.
Click here to get access to the Heat Map.